07 June 2019
Letters from Bruxelles
International trade
The information included in the article Letters from Bruxelles – Growth and savings can be summarised in terms of expenditure. The following, in fact, contributed to forming the EU-28 GDP in 2017: household consumer spending (55.7%), public administration spending (20.1%), balance of trade (3.8%) and expenditure on gross fixed investments (20.5%).
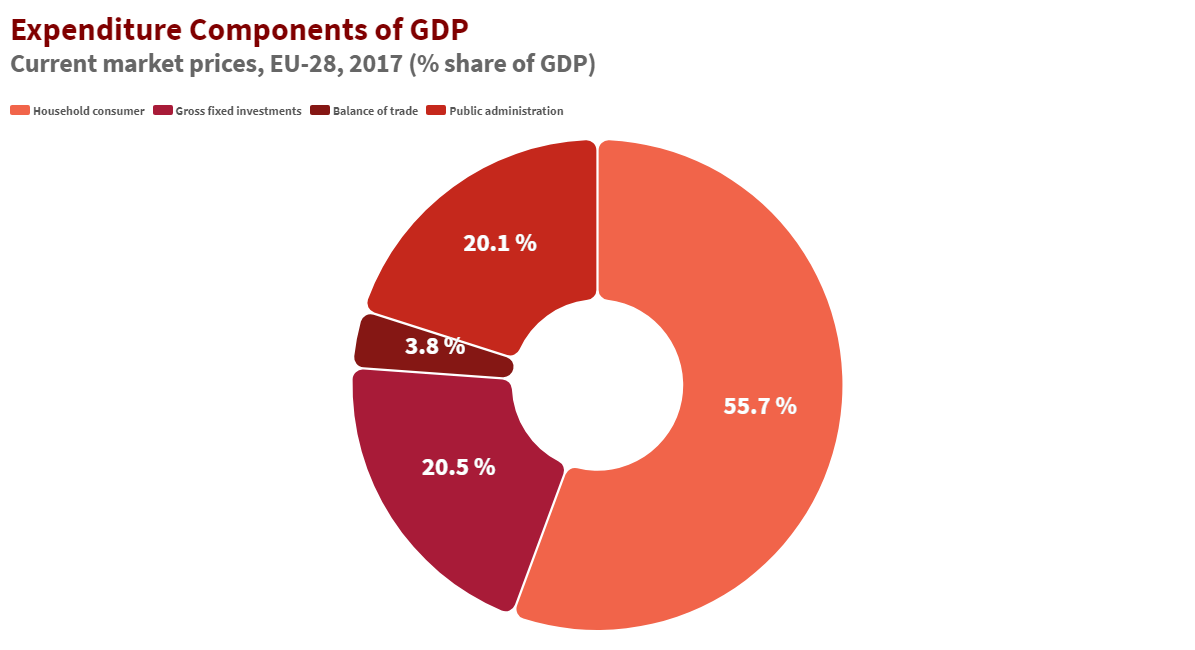
Source: EUROSTAT
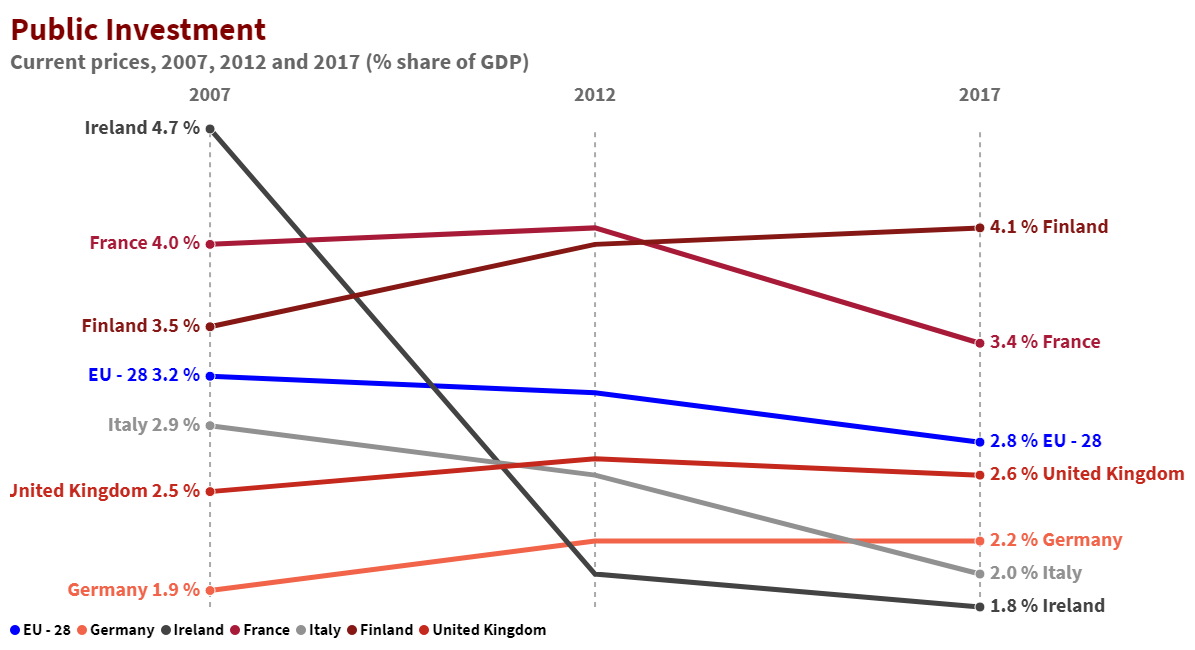
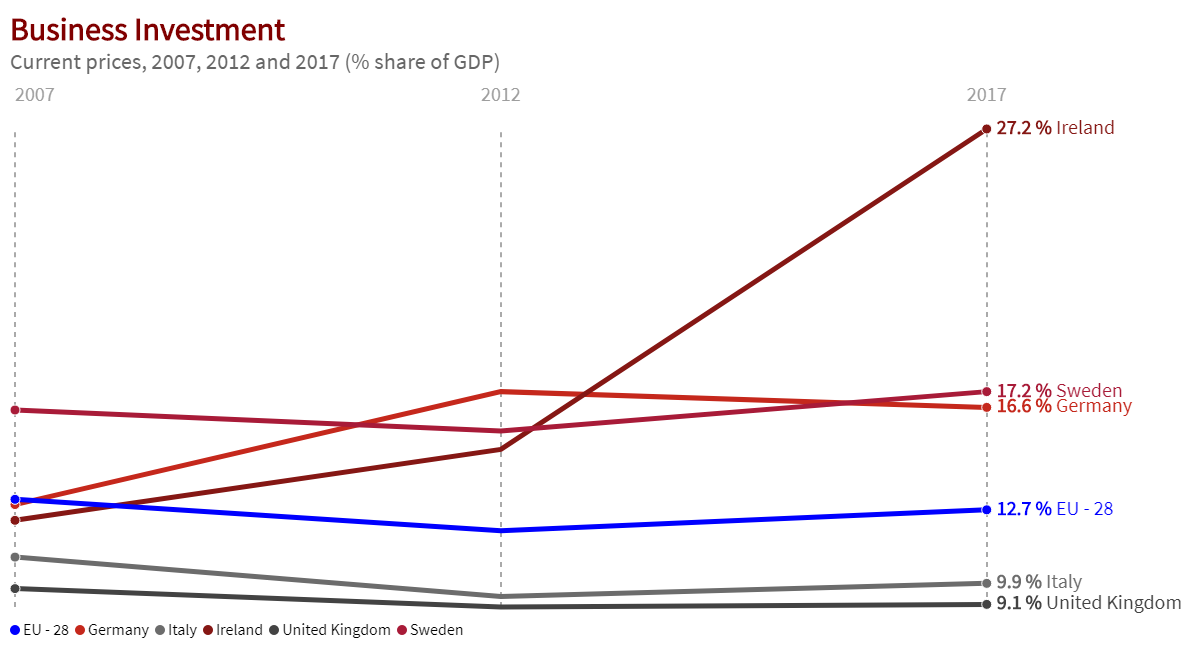
Over the decade, the last of these recorded a not-so-small decline (it was almost 23% in 2007) and the decrease in percentage was as much from the public sector (from 3.2% to 2.8%) as from the private sector (business and household) which fell from 19.1% to 17.9%.
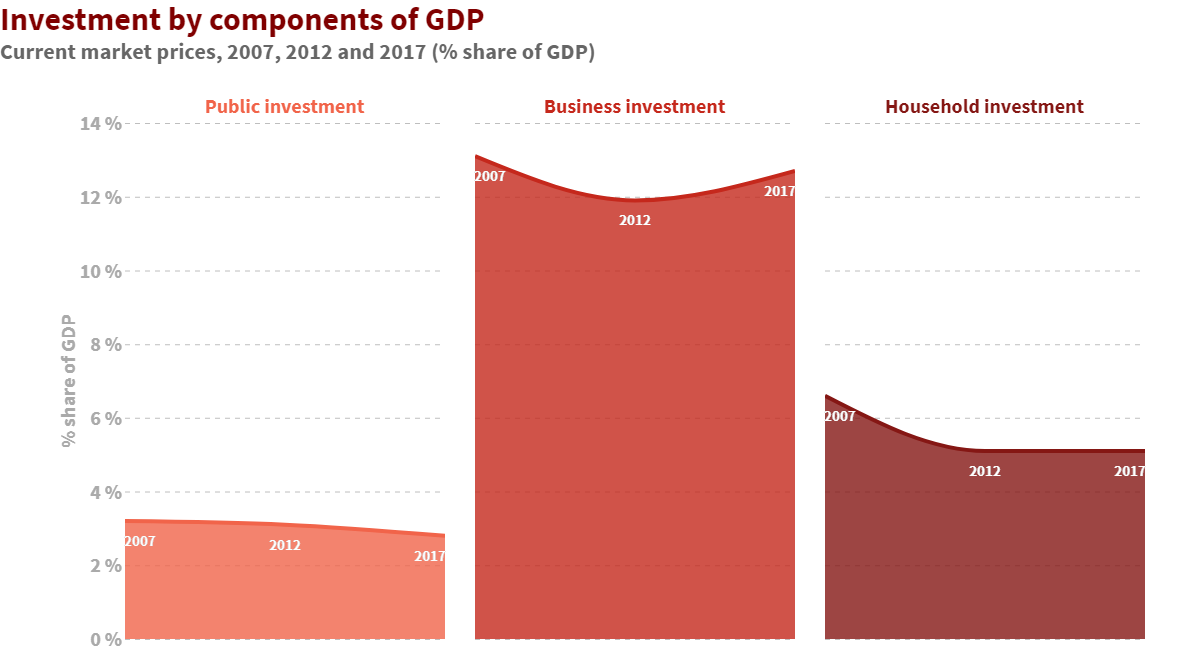
Source: EUROSTAT
Source: EUROSTAT
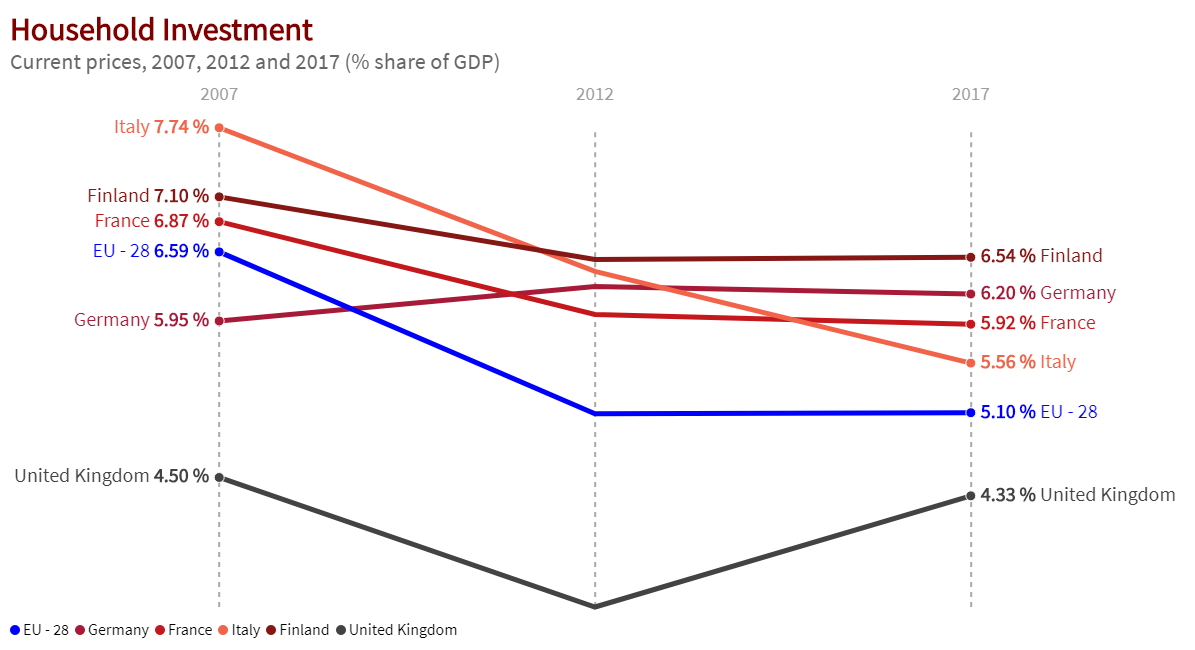
The highest business investment figures came from Ireland (27.2%) and Sweden (17.2%), whilst those for household investments were in Finland (6.5%) and Germany (6.0%).
Source: EUROSTAT
Source: EUROSTAT
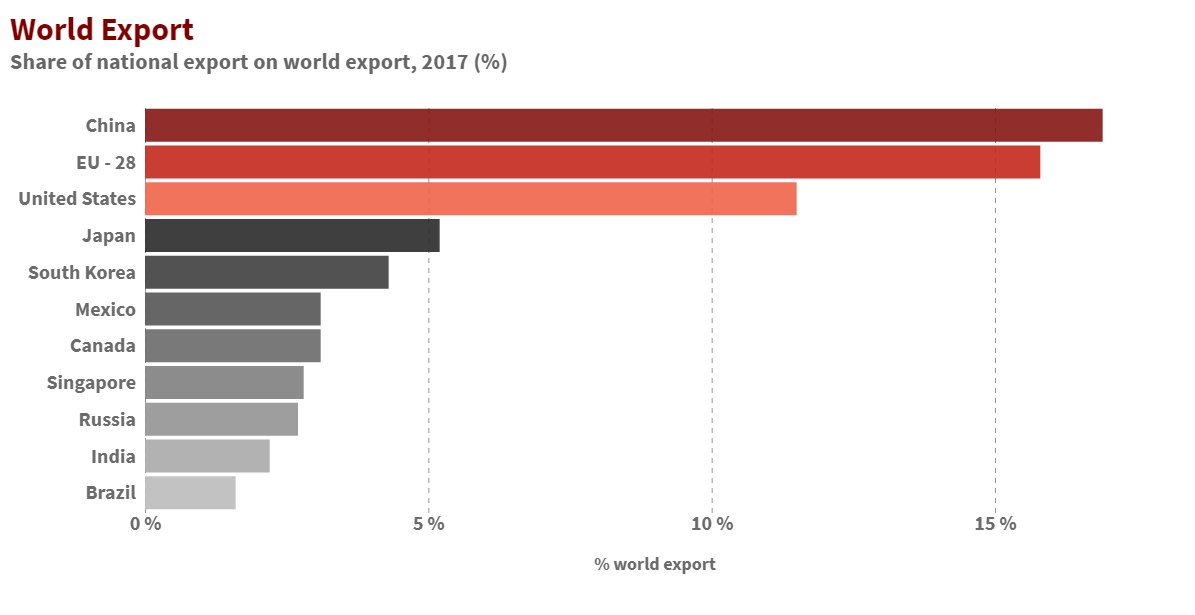
In this scenario, the trends in international trade - where the world’s major players are the USA, China and the EU - are significant. In 2017, EU-28 trade (imports + exports) amounted to €3,735 billion, around 3% higher than China and the USA. Moreover, EU total exports in 2017 accounted for 15.6% of the global total, whilst China reached 17% and the USA a little under 12%.
Source: EUROSTAT
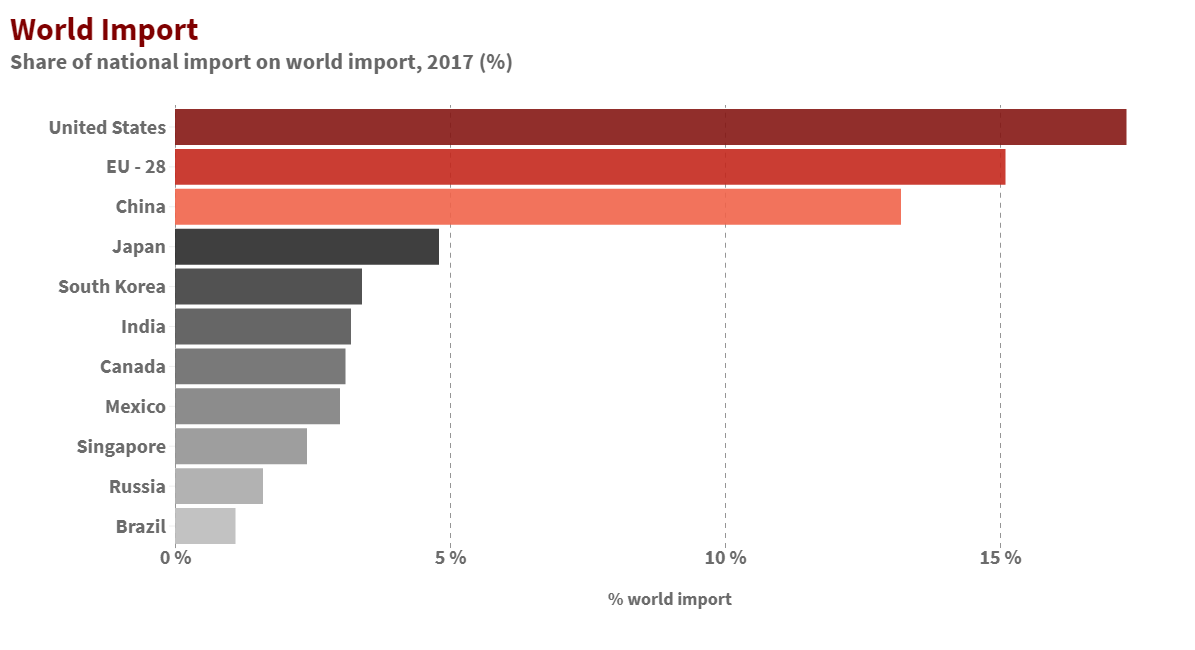
At the same time, the highest imports were those of the USA (17.6%), followed by the EU (14.8%) and China (12.4%).
Source: EUROSTAT
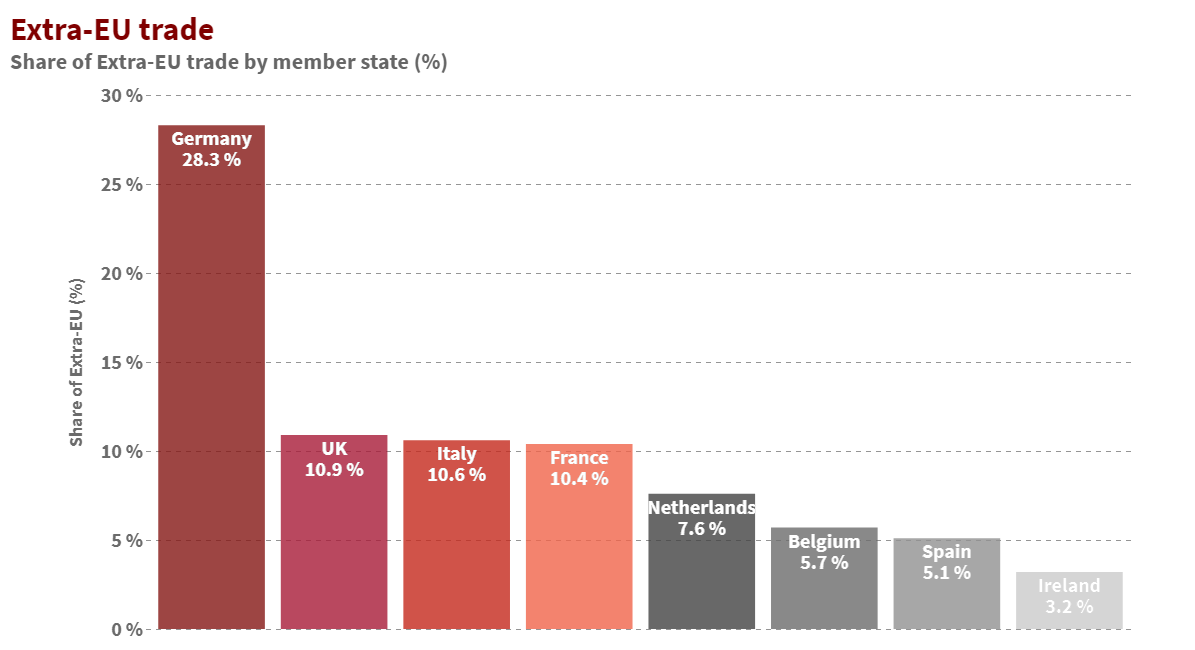
Since 2013, the EU has recorded a balance of trade surplus, narrow but constant, with a value of €23 billion in 2017. Among the member states, Germany is the one recording the highest non-EU trade figures (23% of exports and almost 19% of imports), followed by the UK, Italy and France. As regards the trade surplus, it is again Germany with the highest (over €181 billion), then Italy (over €39 billion) and Ireland (€32.6 billion). The highest deficits are those of the Netherlands (-€129.4 billion: but this figure does not take into account the fact that Rotterdam is the largest European port for incoming non-EU goods, which therefore affect the Dutch accounting figures) and the UK (-€69.2 billion). The USA is the major intake market for EU exports, with a 20% share of its exports total, followed by China (10.5%). There were considerable changes between 2007 and 2017: today the largest intake market is the USA (20% of EU exports), but exports to China (10.5%) have tripled (whilst imports from that country rose by 60%) and those to South Korea doubled. The growth in exports to Japan was more modest (39%) and to Russia exports declined (-3%).
But trade among the various EU member states has a more important role than non-EU trade, and this applies for every single member state: in 2017 the figure reached €3,347 billion, a value 78% higher than EU exports to non-EU countries. In this case, too, Germany plays a leading role (24% of exports to EU countries and a little under 21% of imports). After Germany come the UK, Italy and France with 10.9%, 10.6% and 10.4% of exports, respectively.
Source: EUROSTAT
Overall, the EU’s international trade approach can be attributed to a “horizontal” model, where a country mainly imports and exports goods from the same commodity sector. It is a case of monopolistic competition where it is best for every country to specialise in a limited production range so as to expand the scale of production and reduce costs. Consumers benefit because they see a drop in prices and a stronger availability and variety of consumer goods. In this way, the wide international opening offers an important economic growth opportunity and it is no mere chance that, in order to support this internationally-projected production system, the EU has adopted a common trade policy that sees the European Commission with exclusive power to legislate on trade and the only body entitled to negotiate trade agreements with non-EU countries, thereby representing the interests of all 28 member states.