15 May 2019
Letters from Bruxelles
Growth and saving
The aim of this analysis is to give the reader an overview of how the economic and social structure of the EU evolved from 2007 to 2017 (the last year for which EUROSTAT data is available).
We have tried to offer a complete but summarised snapshot, even though analysing an area of 28 countries as diversified as the EU members proves rather complex, especially as five of them (FR, DE, IT, SP and UK) account for over two thirds of all the income generated, with an obvious “unbalanced” effect.
The picture that emerges is one of an EU still in good health, despite the 2007-2008 crisis and the difficulties that followed, with an overall endurance that has so far seemed to maintain its grip. It has to be mentioned, in this respect, that very recently (February 2019) the European Commission issued GDP performance forecasts for 2019 and 2020.
The situation seems to indicate a severe downturn and an almost recessive trend: for 2019, in fact, the overall GDP performance for EU-28 is forecast at 1.5% and in 2020 at 1.7%.
The Eurozone appears to be the most affected, because in 2019 it is expected to rise by only 1.3% and in 2020 by 1.6%. The situation seems to be compromised even further if we consider that GDP in Germany, the driving force of the EU economy, is forecast to show a very modest 1.1% followed by a 1.7% growth in 2019 and 2020, respectively.
According to the major international agencies (OECD, IMF and UNCTAD) the reason for these performance forecasts lies in world trade, which has seen a drastic decline in the last year, brought about by the serious trade war between the USA and China that was expressed through the now-familiar tariffs dispute.
On this point, however, three comments seem appropriate:
- Firstly, many observers agree on the fact that the current face-off must calm down sooner or later, at least partially, because it is not in the interests of either country to keep such a high level of tariffs (for many goods now as high as 25%);
- According to an accurate UNCTAD study (P. Coke-Hamilton, 8/02/2019), the tariffs between China and the USA will end up benefiting the EU as a result of “trade diversion” (the diversion of trade in favour of the products of a certain country - in this case, EU countries - generated by a change in the prices of the Chinese or American goods tariffed). It is estimated that this diversion could generate €70 billion from more EU products exported;
- Lastly, according to the World Trade Organization (WTO), international trade always has a cyclic trend over at most three years. This means that by 2020 we could see a positive reactivation of the cycle.
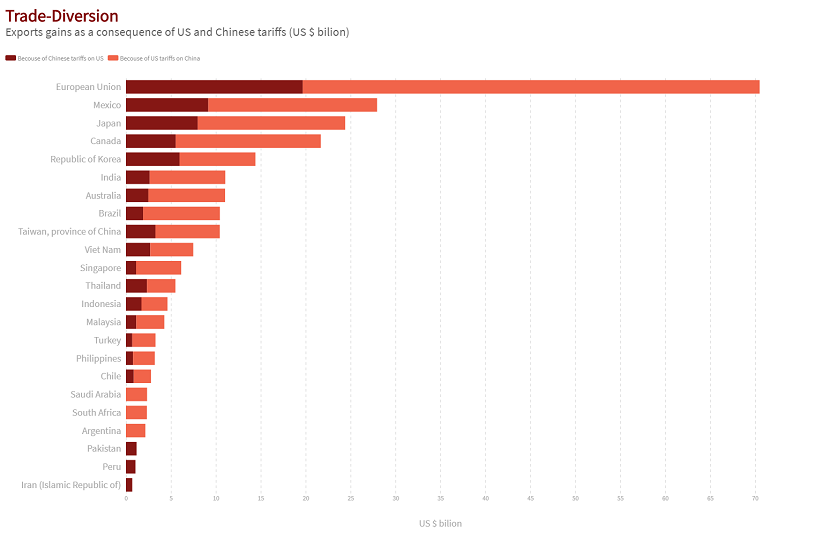
Source: UNCTAD
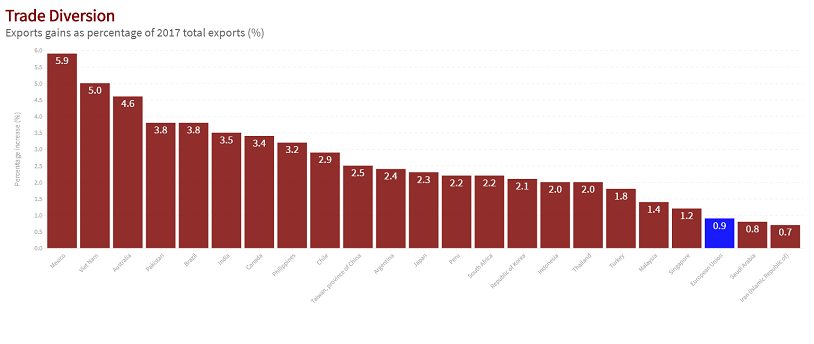
Source: UNCTAD
The last 10 years have been a “roller coaster” for the European economy.
The economic and financial crisis of 2008/2009 generated a deep recession in the EU economies, whilst in other areas of the world production continued to increase at a steady pace (e.g. China, around 10% per year, slowing from 2012 but still stronger than the USA and EU rates).
A strong drop in EU-28 GDP (Gross Domestic Product) was already recorded in 2008, falling from 3.1% in 2007 to 0.5% in 2008, and going as low as -3.1% in 2009. From that year onwards there has been a tidal rise and fall in the trend (only Poland has always seen a plus sign since 2007), and it was only in 2017 that we headed towards a decisively positive value (2.4%). Though this is an average of the different GDP results of the various EU member states, the trends have been more or less similar, with a recovery - for 24 of the 28 countries - dating back to 2011.
In 2017, the Eurozone countries accounted for 70.7% of EU GDP, down a couple of points compared to 2007. As regards the average GDP per capita at current prices, for EU-28 it was €29,900 in 2017: even if many countries recorded a higher value than the EU average, the trend in the last ten years has shown a considerable convergence towards the average, therefore tending to validate the standards of living of the EU member states.
If we analyse the performance of GDP components from an expenditure point of view, that for final consumption (EU-28) rose by 8.1% in real terms in the period considered. Household consumer spending in 2017 contributed almost 56% to GDP formation, whilst spending by public administration accounted for over 20%.
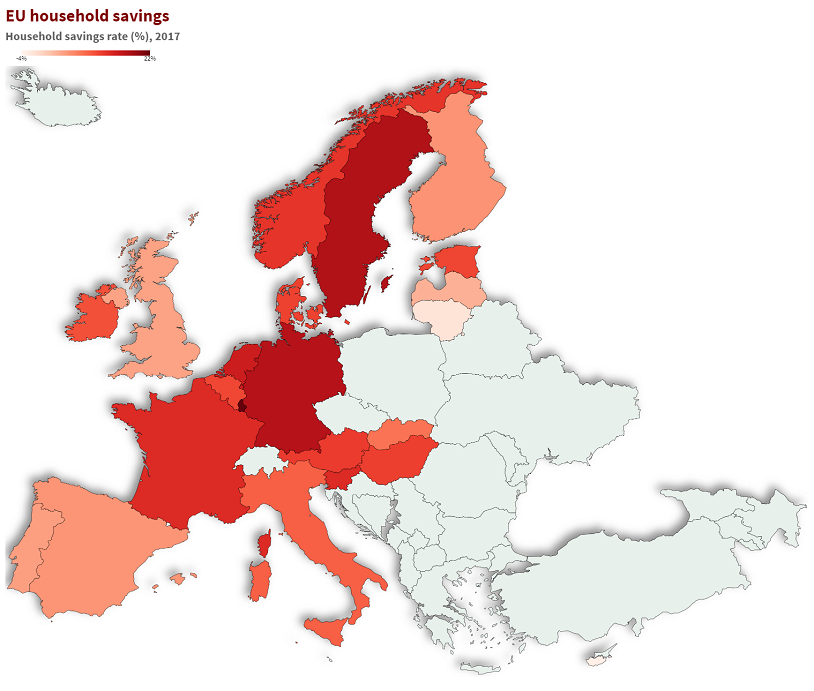
As regards household saving, in the period 2007-2017 the EUROSTAT figures indicate that the savings-income ratio (or savings rate) recorded a strong increase in 2009, after the 2008 crisis and the resulting uncertainty about the future, both in EU-28 (10.78% in 2007 and 12.91% in 2009) and the 19 Eurozone countries (12.52% in 2007 and 14.20% in 2009). For the entire period 2007-2017 the Eurozone savings rates were considerably higher than those of EU-28, with the difference fluctuating from 1.72% in 2007 to 2.21% in 2017. From 2009, household savings rates tend to decline in both European areas, though with some exceptions: in 2017 they remained very high in Germany (17.30%), France (13.88%), Netherlands (15.54%) and Italy (9.83%). Lastly, they were relatively low in countries such as Spain (5.53%), Portugal (4.71%) and the United Kingdom (4.49%).
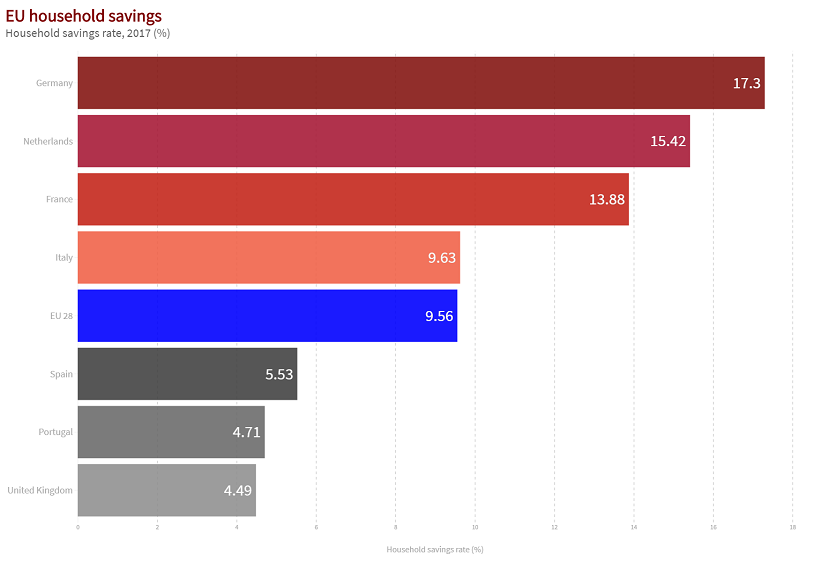
Source: EUROSTAT
Source: EUROSTAT
In the same period, EU-28 investments proved to be highly volatile, fluctuating strongly until 2013 and only stabilising in the last few years: in 2017, the percentage of gross fixed investments in EU-28 was 20.8% of GDP.
Exports in the EU as a whole increased over the decade by over 33% and imports by more than 26%, and so the balance of trade contributed a little less than 4% to GDP.