Mind the curve
By Vincent Chaigneau, Head of Research, Generali Investments
The virus - galloping, but less deadly. Covid is spreading like never before, the stats say. 17 June saw 169k new Covid cases, the highest ever. The 5-day rolling average, currently at 140k, is 50k higher than in mid-May.
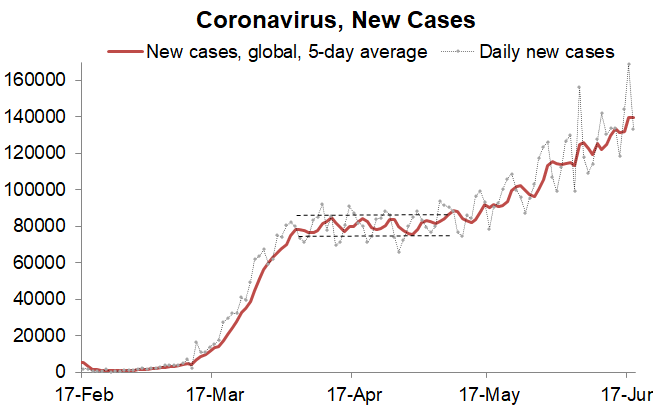
Arguably, the numbers today are likely more truthful than in the past, because there is more testing. The silver lining is that the fatality rate has been declining (see chart), from a peak at 7.2% (cumulated deaths / total cases) in late April to below 5.4% now.
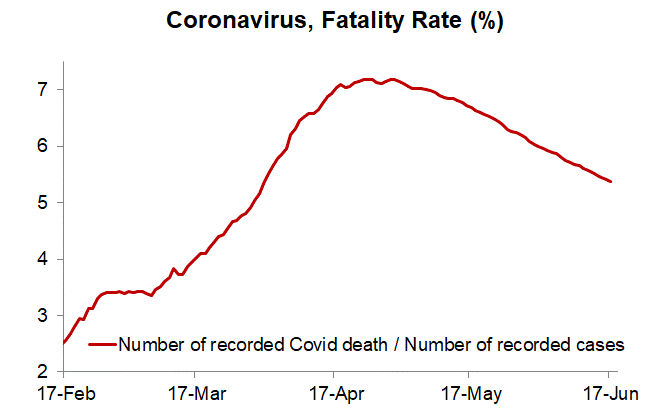
This decline may reflect various factors: Covid-19 has propagated to the developing world, where the population is younger; testing catches a younger sample of people (average age of recorded people falling); the virus might have become less strong; hospitals are doing a better job treating patients etc. There were also news early this week of a widely available and cheap anti-inflammatory drug (Dexamethasone) reducing the death rate. For all these reasons, financial markets are not losing sleep on the galloping propagation of the virus.
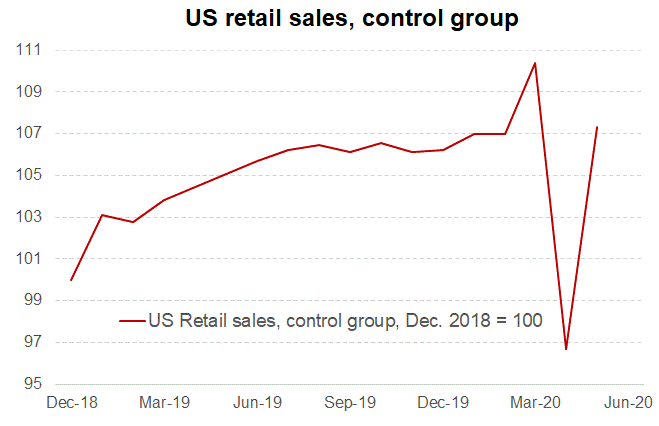
The economy - just an illusion? The economy has turned around already, with data over the past week echoing the message from a better than expected US employment report for May.
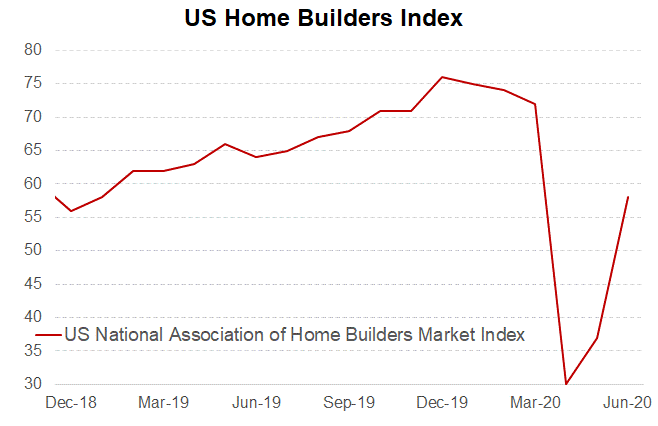
Those predicting a V-shape recovery are feeling comforted, as indicators such as US retail sales or house building are starting to look like it (see charts).
The economy is also turning in Europe. In France, INSEE (National Statistics) estimates that the activity loss (vs normality), which was an abyssal 29% in April, has eased off to just 12% in June.
The normalisation is contrasted, however, with mobile phone data suggesting that the home-work commute is still 40% below pre-crisis. INSEE revised the French Q2 GDP forecast from -20% to -17% (after -5.3% in Q1). Let us reiterate that the rebound is not surprising, as a large pent-up demand is being unleashed after the lockdown.
The durable effects of higher unemployment and impaired corporate balance sheets will be visible later. Still, the narrative over summer may focus on a strong recovery, as economic data continues to rebound.
The V-shape will likely be a summer illusion, but one that may keep risk assets supported a while longer, and confer a small advantage to cyclical assets (positive for cyclical stocks, EM currencies and equities, bearish USD).
Banks - ECB offers relief to an ailing sector.
Euro area banks borrowed a staggering €1.3 trillion from the ECB at the TLTRO-III operation, a record high.
Arguably this is partly covering earlier ECB loans coming to maturity, but the net take-up, at near €550 billion, is also a record.
Banks will have borrowed at -1% if they meet the (relaxed) lending objectives; before the use the money for lending, they can park the cash at the ECB at -0.50% and make an easy 50bp profit.
Such deposits are now conveniently excluded from the leverage ratio calculation; that exclusion is part of a regulatory relief, which also frees up the banks from capital contributions when the value of their government bond holdings declines (as we discussed here).
As we showed last week, banks have already started to park more cash in government bonds, and we expect this to continue as the TLTRO is settled on 24 June.
This should further support the sovereign (and IG credit) spread complex.
Policy support keeps coming. The policy news has remained intense over the past week. A non-exhaustive list includes: 1/ The Fed launched its program of corporate bond purchases in the secondary market.
This was due, but the conditions have been relaxed. Corporations in particular do no longer have to opt-in, hence the stigma attached to the Fed purchases disappears – good news again for Credit.
2/ The Bank of England added £100bn to its QE program (the market got disappointed however as the BoE said it planned to complete the program by end 2020, offering no guidance for next year; also rate cuts were not even discussed).
3/ US policy makers are discussing an infrastructure plan, in the region of $1.0-1.5 trillion (4.3-6.5% of GDP).
4/ Brexit talks were slightly more constructive; however we expect limited progress this summer; the game will likely be played in September and October.
Volatility retreating. Reassuringly, and as we expected, there was little follow-through to the sharp 11 June risk-off correction. After a brief surge (VIX above 40) volatility has retreated, across asset classes – see left-hand chart below.
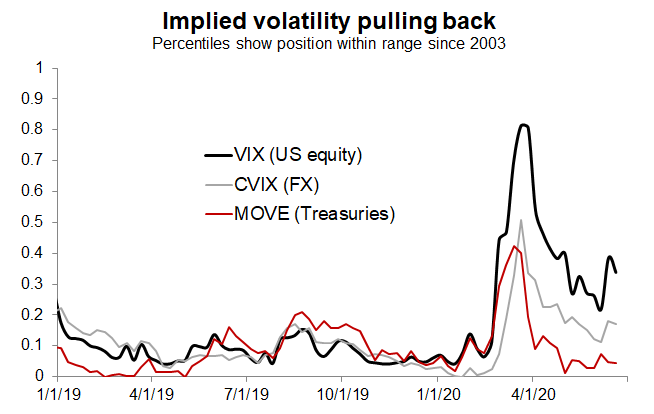
Mind that Rates volatility has pulled back particularly fast, and in the US is now returning towards historical lows.
The Fed has helped greatly, by announcing, early in the crisis, unlimited QE; the Fed dots are also suggesting that key rates will be on hold for years, and the Yield Curve Control (YCC) discussion is making very clear that the Fed intends to keep long rates very low. Not many will want to pick a fight against the Fed, at least not before inflation shows its ugly face, which is a far-distant risk in our opinion. Lower rates volatility tends to support the Fixed Income carry trade, hence tight credit spreads.
Mind the curve. In Europe too, we expect bond yields to stay low, as inflation remains at low levels and the ECB sticks to its frantic purchasing plan.
We see room for long-dated rates (30-year and above), however, to rise a bit, at least on a relative basis.
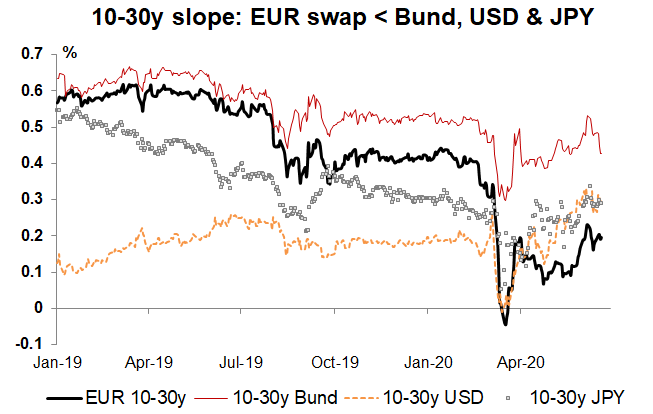
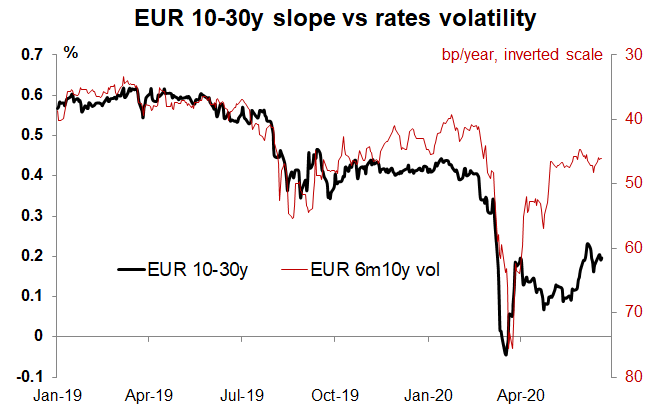
A pullback in rates volatility tends to steepen the 10-30y slope, but the latter has lagged over the past couple of months (see chart above).
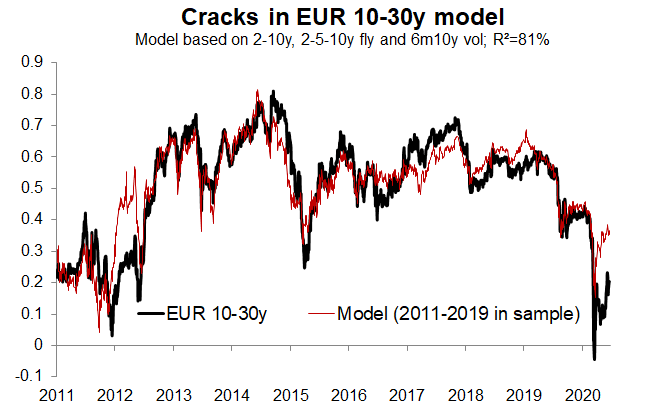
A more complete curve model suggests that the fair value for 10-30y EUR is around 35bp, while the swap slope stands at 19bp (left-hand chart below).
Part of the explanation may lie with insurers actually; the sharp risk sell-off in March had a significant impact on Solvency ratios, causing some de-risking of portfolios and efforts to save capital, for instance by reducing the duration gap (duration of liabilities longer than that of assets).
The Solvency II review, currently into (heated) discussion, is also seen as potentially adding to receiving flows and causing curve flattening; that said EIOPA recently delayed the review, with the advice now due only by end 2020, and the reform not effective before January 2022 (at the earliest).
More tangibly, the Dutch government has just proposed a pension reform, which is likely to become law.
The reform will support a transition, from 2022 to 2026, from a Defined Benefit to a Defined Contribution framework, implying a lower need for duration hedging.
The Dutch Pension Fund industry, with nearly €1.5 trillion in assets, is by far the largest of the euro area, and flows there are having a significant impact on the long end of the EUR curve. The largest impact would likely be in long-term EUR swaps, implying a steepening of the 10-30y slope and a richening of long-dated cash bonds relative to swaps.
As the final chart below shows, there is room for the EUR 10-30y swap slope to steepen, as it has lagged comparable curves (Bund, USD and JPY swaps).