Interim financial information - Press release (1)
10 November 2016 - 07:30
- Solid results confirmed by improved Life and P&C technical performances. Stronger third quarter
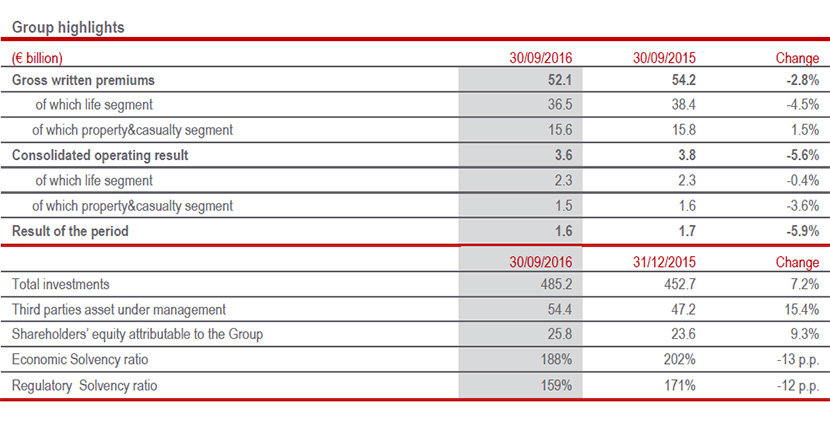
- Premiums at € 52.1 bln (-2.8%): continued growth in P&C business (+1.5%) and the increasingly disciplined approach in Life segment (-4.5%) characterized by the high quality of the net cash inflows exceeding € 10.1 bln
- Improved Combined Ratio to 92.4% (-0.2 p.p.)
- Operating result above € 3.6 bln (-5.6%) with recovery in third quarter (+7.3%) and net profit over € 1.6 bln (-5.9%), accelerating in the last three months (+6.4%). These results have been achieved within a financial context characterized by low interest rates and also reflect planned lower realised gains as a result of managerial action in line with the strategy of preserving future profitability
- Annualised Operating RoE at 12.7%
- Solid capital position with Economic Solvency Ratio at 188%; Regulatory Solvency Ratio at 159%
The General Manager and Group CFO of Generali, Alberto Minali, commented: “The results presented today confirm the strength of Generali’s business model. In fact, in a still difficult market context, Generali continued its disciplined management of Life business, which aims to favour its quality and profitability. In Property&Casualty premiums increased, which allows us to make progress in a segment with excellent profitability levels. Thanks to the quality of these revenues, which are the result of the work of all our employees and networks, technical performances improved further, particularly in the third quarter, which registered improved operating result and net profit. This is despite the fact the investment results declined, due to the planned lower realisation of gains, the ongoing market volatility and persistently low interest rates. The annualised operating RoE, which reflects the slowdown registered in the 2015 final quarter, will be line with the targets at the end of this year. The solidity of these results is further confirmed by the capital position of the Group, which remains at very good levels despite the challenging economic environment”.
Wien. At a meeting chaired by Gabriele Galateri di Genola, the Assicurazioni Generali Board of Directors approved the interim financial information as of 30 September 2016.
Premiums and New Business
- The gross written premiums of the Group reached € 52.1 billion (-2.8%2; € 54.2 bln 9M15). P&C premiums rose by 1.5%, driven by the Motor segment (+3.3%) which confirms the recovery already registered in the half year, while Life volumes (-4.5%) reflects the increasingly disciplined approach in the product offer with a high quality of the net cash inflows exceeding € 10.1 billion (-7%), as a result of the constant policy of active management of the Group’s portfolio in order to boost its profitability.
- The New business in terms of APE (Annual Premium Equivalent) stood at € 3.6 billion (-4.8%) reflecting the adverse market conditions. The New business value rose by 19.7%, amounting to € 0.9 billion (€ 0.8 bln 9M15). The actions taken to recalibrate both guarantees and products, together with a more favourable products business mix, led to greater profitability, with a New Business Margin at 25.3% (20% 9M15).
Financial Performance
- The operating result, amounting above € 3.6 billion (-5.6%; € 3.8 bln 9M15), continues to be sustained by the improvement in the Life and P&C technical performances, while the financial performance tapered off. The third quarter of the year registered a recovery; in fact, the operating result recorder a marked increase of 7.3% over 3Q15 due to the improved technical performance of Life business and solid quarterly performance of Banca Generali.
Thanks to the positive development of the technical margin, the Life business operating result in the first nine months is essentially stable at € 2.3 billion (-0.4%). The P&C operating result, standing at € 1.5 billion, instead recorded a decrease of 3.6%, affected by the current return on investments. By contrast, the technical performance was positive, with a combined ratio which further improved to 92.4% (-0.2 p.p.; 92.7% 9M15), including the impact of 1.3 p.p. of natural catastrophe claims totalling € 0.2 billion, of which € 10 million relating to the earthquake in central Italy.
The Group’s net profit exceeded € 1.6 billion (-5.9%), marking a recovery of 6.4% in the third quarter compared to the same period in 2015. - The P&L return on investments amounted to 2.6% (3.1% 9M15)3. In the present context of low interest rates, current return went from 2.5% to 2.4% and the P&L return of other components decreased due mainly to the lower contribution from realised gains.
The Life P&L return on investments went from 3% to 2.6% while in the P&C segment, it dropped from 3.1% to 2.4%.
Balance Sheet/Capital Position
- The Group shareholders’ equity amounted to € 25.8 billion, up by 9.3% compared to € 23.6 billion as of 31 December 2015. The variation is attributable to the result for the period of € 1.6 billion and gains on available for sale financial assets of € 2.3 billion (+37.5%), which more than offset the payment of the dividend totalling € 1.1 billion and the decrease of € 0.6 billion deriving from the reduction in the reference interest rates applied in the actuarial calculation of liabilities relating to defined benefit plans in favour of employees.
- The Economic Solvency Ratio, which represents the economic view of the Group’s capital and is calculated by applying the internal model to the entire Group perimeter, stood at 188% (202% FY15; -13 p.p.).
The Regulatory Solvency Ratio – which represents the regulatory view of the Group’s capital and is based on use of the internal model solely for companies that have obtained the relevant approval from IVASS, and on the Standard Formula for other companies – stood at 159% (171% FY 20154; -12 p.p).
Strong recurring capital generation made it possible to maintain an excellent level of solvency and to partially offset the negative impact of the adverse economic context.
The Manager in charge of preparing the company’s financial reports, Alberto Minali, declares, pursuant to paragraph 2, article 154-bis of the Consolidated Law on Finance, that the accounting information in this press release corresponds to the document results, books and accounting entries.
For the significant events that occurred in the period and after 30 September 2016, please refer to the press releases downloadable from the website www.generali.com.
The Generali Group’s Investor Day will be held in London on 23 November.
DEFINITIONS AND GLOSSARY
Gross written premiums = Equal to gross written premiums of direct business and accepted by third parties.
Gross direct premiums = Equal to gross written premiums of direct business.
Annual Premium Equivalent (APE) = It is an indicator of volumes of life segment, annual and normalized, and it is equivalent to the sum of new annual premium policies, plus a tenth of premiums in single premium policies (net of the portion attributable to minority interests).
New business value (NBV) = It is an indicator of new value created by the new business of life segment. Is obtained by discounting at the date of new contracts the corresponding expected profits net of the cost of capital (net of the portion attributable to minority interests).
New Business Margin (NBM) = It is a performance indicator of the new business of life segment, equal to the ratio NBV / APE.
Net cash inflows = It is an indicator of cash flows generation of the life segment. It is equal to the amount of premiums collected net of claims and benefits paid (outflows) of direct insurance business.
Combined Ratio (COR) = It is a technical performance indicator of the P&C segment, calculated as the weight of the loss ratio and the acquisition and general expenses (expense ratio: acquisition + administration expenses) on the earned premiums.
Current accident year loss = It is a further detail of combined ratio calculated as the ratio between: current year incurred claims + related claims management costs net of recoveries and reinsurance; and earned premiums net of reinsurance.
Previous accident years loss = It is a further detail of combined ratio calculated as the ratio between: previous years incurred claims + related claims management costs net of recoveries and reinsurance; and earned premiums net of reinsurance.
Solvency II Regulatory ratio = defined as the ratio between the Eligible Own Funds and the Group Solvency Capital requirement, both calculated according to the definitions of the SII regime. Own funds are determined net of proposed dividend. The ratio at 30 June 2016 has to be intended as preliminary since the definitive Regulatory Solvency Ratio will be submitted to the supervisory authority in accordance with the timing provided by the Solvency II regulations for the official reporting.
Economic Solvency ratio = defined as the ratio between Eligible Own Funds and the Group Solvency Capital requirement, both calculated applying the internal model also to all the companies for which at present the authorization was not obtained yet.
Equivalent consolidation area = Refers to equivalent consolidation scope.
Equivalent terms = Refers to equivalent exchange rates and equivalent consolidation scope.
Operating result = obtained by reclassifying the components making up earnings before tax in each line of business on the basis of the specific characteristics of each segment, and taking account of recurring expense of the holding. All profit and loss items were considered, with the exception of net non-operating costs, i.e., results of discontinued operations, corporate restructuring costs, amortisation of portfolios acquired directly or through acquisition of control of insurance companies or companies in the holding and other activities segment (value of business acquired or VOBA) and other net non-recurring costs. In the Life segment, the following are also considered as non-operating items: realized gains and losses on investments not considered in determining profits attributed to policyholders and net measurement losses that do not contribute to the formation of local technical reserves but exclusively in determining the deferred liability to policyholders for amounts not relating to policyholders and those on free assets. In the P&C segment, the following are considered as non-operating items: all realized and measurement gains and losses, including exchange-rate gains and losses. In the holding and other activities segment, the following are considered as non-operating items: realized gains and losses and non-recurring net measurement losses. The total operating result does not include non-operating holding costs such as interest expense on borrowings and costs arising from parent stock option plans and stock grants.
Operating return on equity = an indicator of return on capital in terms of the Group operating result adjusted related to the Group shareholders’ equity. The annualized operating RoE is calculated as the sum of the last four quarterly operating Roe ratios.
P&L Return on Investments = calculated as the weight of the following components on the average investments:
- interest and other income, including income from financial instruments at fair value through profit and loss (excluding income from financial instruments related to linked contracts) net of depreciation on real estate investments for the current return;
- net realized gains, net impairment losses and realized and unrealized gains and losses from financial instruments at fair value through profit and loss (excluding those from financial instruments related to linked contracts), exchange rates impacts and investment management expenses.
For a description of the alternative performance measures, please refer to the Methodological Note of the Group Annual Integrated Report and Consolidated Financial Statements 2015.
1 Following the amendment to paragraph 5, of art. 154-ter of Legislative Decree no. 58 of 24 February 1998, the obligation for listed issuers to publish the Interim management statement was removed. As already indicated in the press release of 29 September, Assicurazioni Generali decided to publish, on a voluntarily basis, for the first and third quarters, the interim financial information on specific significant indicators for the description of the business performance and capital position of the Group. These indicators are consistent and comparable to those provided in the Group’s half-year and annual reports.
The data in this press release are indicated in billions of euro, rounded to the nearest decimal point.
2 Changes in premiums, net inflows and Annual Premium Equivalent (APE) are presented in equivalent terms (at constant exchange rates and scope of consolidation).
3 The % of the P&L return on investments is not annualised.
4 The ratio has been submitted to the Supervisory authority in accordance with the timing provided by the Solvency II regulations for the official reporting and it represents an update of those disclosed on March 18, 2016.