Swoosh Recovery vs. Liquidity Splash
By Vincent Chaigneau, Head of Research, Generali Investments
The exit from the lockdowns is proceeding cautiously. With the number of new cases globally still above 80k per day, scientists keep warning about the risk of relaxing social distancing too quickly. In the meantime the global economy struggles – we slightly cut our 2020 global growth forecast from -3.5% to -4%. The risks are skewed to the downside, if in particular contagion starts to pick up again, now or in the autumn.
The ‘swoosh’ (or Nike) recovery. We briefly rejected last week the idea of a V-shaped recovery. The economic alphabet can be tedious, but the shape of the recovery does matter for investment. Hopefully the second half of the year will see a sharp rebound of PMI surveys and the year-on-year change in production, following the 20H1 collapse. But that does not make a V-shaped recovery. The latter occurs when production (GDP) or profits quickly return to pre-crisis levels (employment always lags, particularly in post-modern recessions). The symmetry of the letter V implies that some of these variables snap back up almost as fast as they fell. But in our book, by the end of 2021 the global and the Eurozone GDP will still not have returned to the level of end-2019. Even a U-shaped recovery appears unlikely.
Two types of recession. Recessions are never exactly the same, but let’s group them in two broad categories.
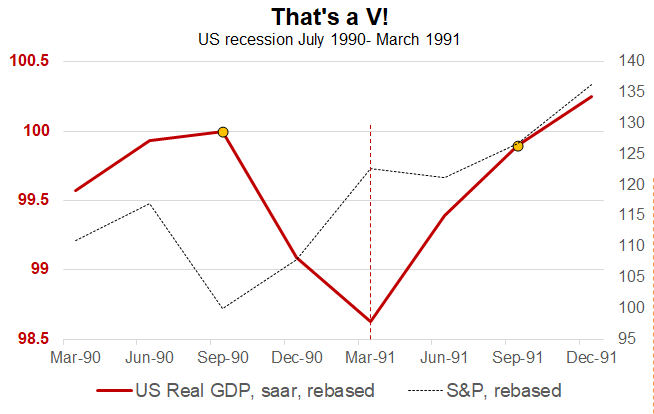
- The first, less painful, consists of a natural death of the cycle (e.g. US recession of 1990-91) or a transient exogenous shock (modest recession of 2001 marked by the bursting of the internet bubble and the 9/11 terror). The recession from July 1990 to March 1991 (NBER dates) saw a V-shaped recovery: by the end of 1991, the US GDP was back to its peak (see chart).
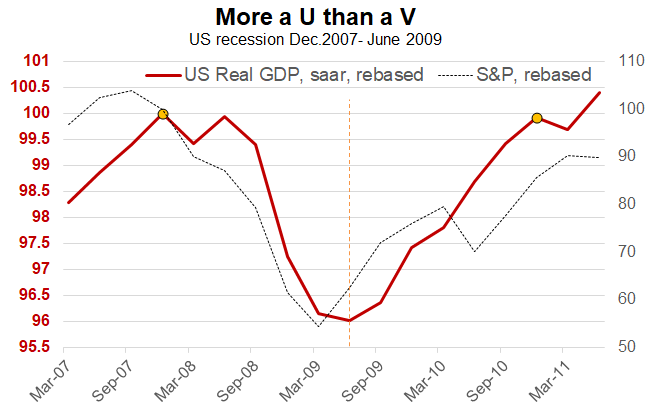
- The second, more painful category includes deeper recessions, following the bursting of speculative bubbles and/or severe balance sheet imbalances. The Great Financial Crisis (GFC) of 2008-09 was born out of a dual credit and real estate bubble. The recession was longer (December 2007-June 2009) and deeper (GDP down 4 points from peak to trough, vs. just -1.4 points in 1991). It took three years for real GDP to return to the end-2007 level - a typical case of U-shaped recovery (see chart).
Mapping the 2020 recession. Does the 2020 recession belong to the first category, given the exogenous nature of the shock and hopefully, the brevity of the recession? Probably not.
- First, social distancing will slow the normalization of supply. In the worst-case scenario, successive endemic waves would cause a depression. Even in the central case, social distancing rules will imply a loss of productivity in the coming months, even quarters.
- Second, the recession will be deep, with a loss of GDP of around 13-14 points (our estimates) in the United States and Europe from peak to trough (Q4 2019-Q2 2020). This is the deepest loss of output since the 1930s. It will be impossible to recover such a fall in just two quarters.
- Finally, this recession comes after a growth cycle of more than 10 years in the United States, which has seen a further rise in aggregated non-financial debt (states, non-financial corporate and households). By fall 2019, global non-financial debt was estimated at $190 trillion, or 240% of world GDP, a new record. This year only, net public debt globally will increase by more than 15 points of GDP. Corporate debt is the sector that has seen the largest rise since 2009; the depth of the recession will further deteriorate corporate balance sheets, making second-round effects inevitable: companies will delay investment and hiring. The US unemployment rate surged from 3.5% to 14.7% in just two months. Unemployment is mostly classified as temporary (78%), but some job losses will become permanent. Already 8 million people, discouraged, have dropped out of the statistics (on top of the 21 million jobs lost). It is mainly low-paid workers who have been affected – those have the highest propensity to spend. This, as well as the rise in precautionary savings, will hamper consumer trends.
Why shapes matter. So forget about a V-shaped recovery, we see a “swoosh” or “Nike” tick. The shape of the recovery matters both socially (employment, standards of living etc.) and financially. Stock prices depend on future profits, which themselves are a magnifier of GDP trends. The ‘swoosh’ recovery does not bode particularly well for cyclicals stocks. As usual, profits are collapsing through the recession, both in absolute terms and relative to GDP (left chart below).
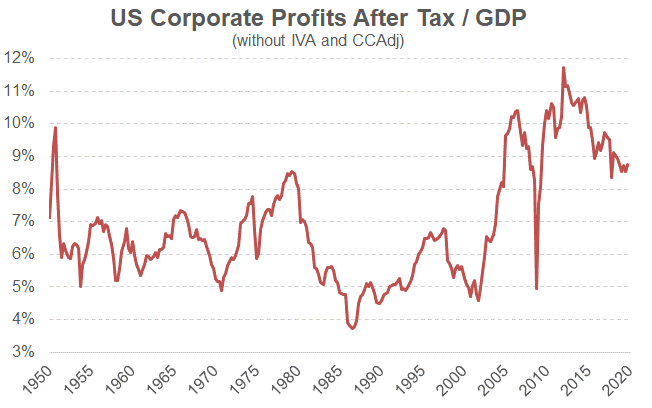
As the Q1 earnings season draws to an end, profits are down 25% yoy in the EU, and 13% in the US. Q2 will be much worse. As usual the share of profits within GDP will later rebound, but maybe not as fast as it did after the Great Financial Crisis. In particular some of the old drivers of the rise in the profit/GDP ratio may be questioned: the globalisation of the supply chains, the tax race to the bottom or the unchallenged rise of global corporate giants.
In this context, equity valuation is not cheap; the MSCI World is priced at 18 times the profits of the next 12 months – vs. just 15-16 times a year ago (right-hand chart below).
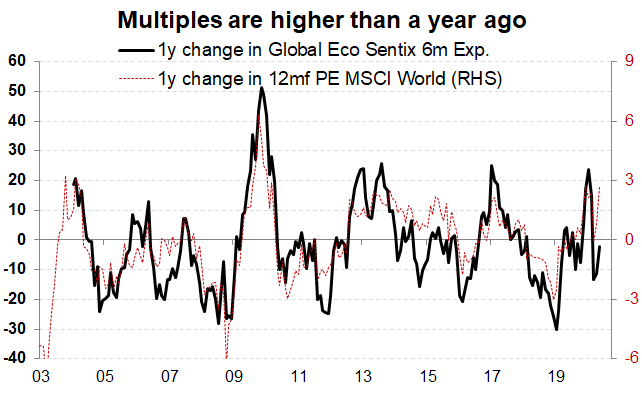
Such valuation, as well as the relative complacency of investors regarding the shape of the recovery (same chart), keep us somewhat cautious towards equity investment. That said, central bank actions do support elevated multiples.
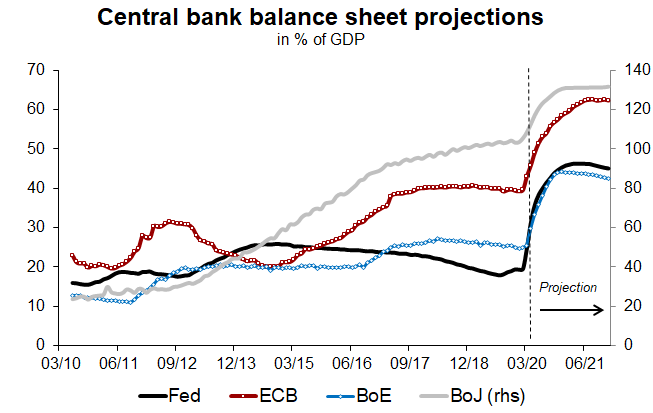
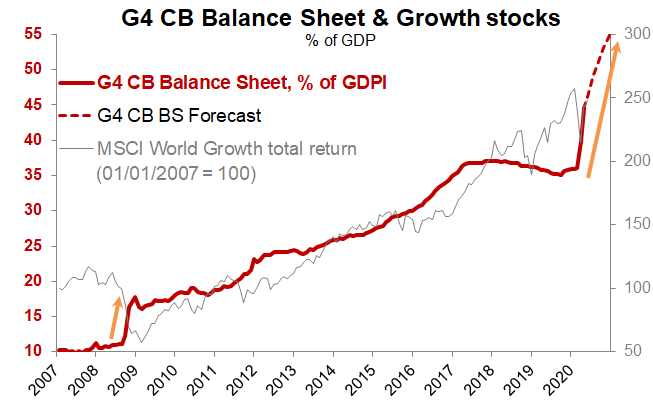
Liquidity splash. Without the tremendous response from policy makers, we would be talking about an L-shaped recovery. The fiscal and monetary stimulus is unprecedented in the United States. The public deficit will hit about 20% of GDP, while the Fed’s balance sheet should swell by more than 25 points of GDP. We estimate that the balance sheet of G4 central banks will grow by almost 20 points of GDP (from 35% to 55%). This is as much as between 2008 and 2016 (from 10% to 30%).
We know very well already that money printing does not necessarily imply consumer price inflation (the velocity of money will fall). On the other hand, surging money supply tends to impact asset prices more systematically. Arguably the preference for liquidity has increased; the appetite for risk-free money market funds, for example, grew sharply during the crisis. But sooner rather than later the hunt for yield will return.
→ The liquidity splash, combined to a limited appetite for risk (typical in post-traumatic periods), will support assets offering some yield but a contained risk profile, such as Investment Grade corporate bonds, non-cyclical sectors, growth stocks (also supported by low rates for longer) and residential property.